PyQueryHub Overview
Welcome to PyQueryHub! This guide highlights key features to help you connect data, build insightful reports, and share them effectively.
Get Started
Set up your foundation for data exploration and collaboration.
🔌 Connect Your Database
Start here! Before building reports and charts, connect to your data sources to unlock PyQueryHub's full potential.
Set Up Database Connections
Securely connect to your databases (MySQL, PostgreSQL, BigQuery, Google Sheets, etc.). Manage credentials, and optionally use SSH tunneling or SSL encryption.Database Types Guide
Detailed setup instructions for each supported database type with connection examples and troubleshooting tips.
Additional Setup
- Workspaces: Create and manage collaborative workspaces with role-based access control, domain verification, and SSO integration for seamless team collaboration.
- Channels: Define where notifications (Email, Slack, WhatsApp, Telegram) are sent for alerts and updates.
- Collections: Organize reports into dedicated collections with granular access control. Create public shared collections or private personal workspaces, and manage access through individual users or groups.
Reports
Transform your data into actionable insights.
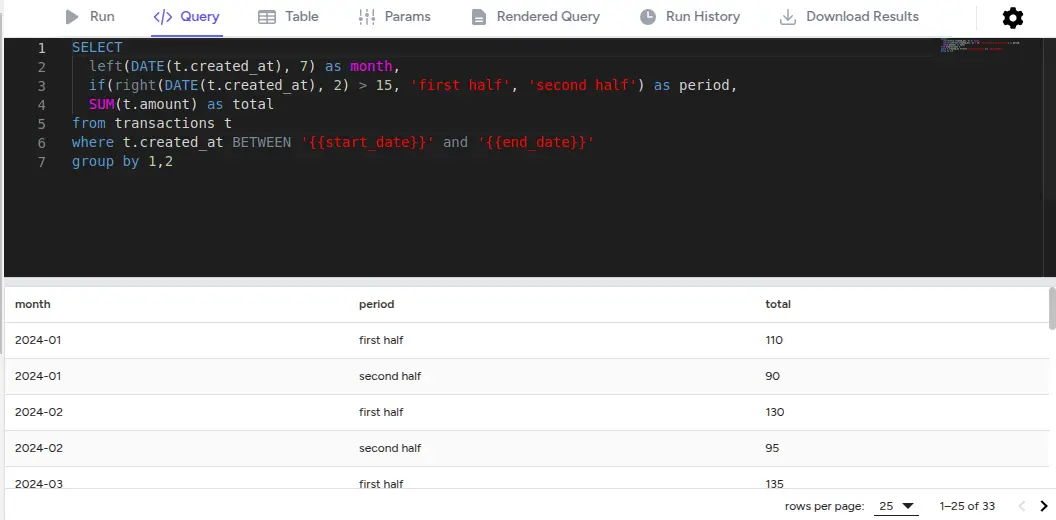
Write Your Queries
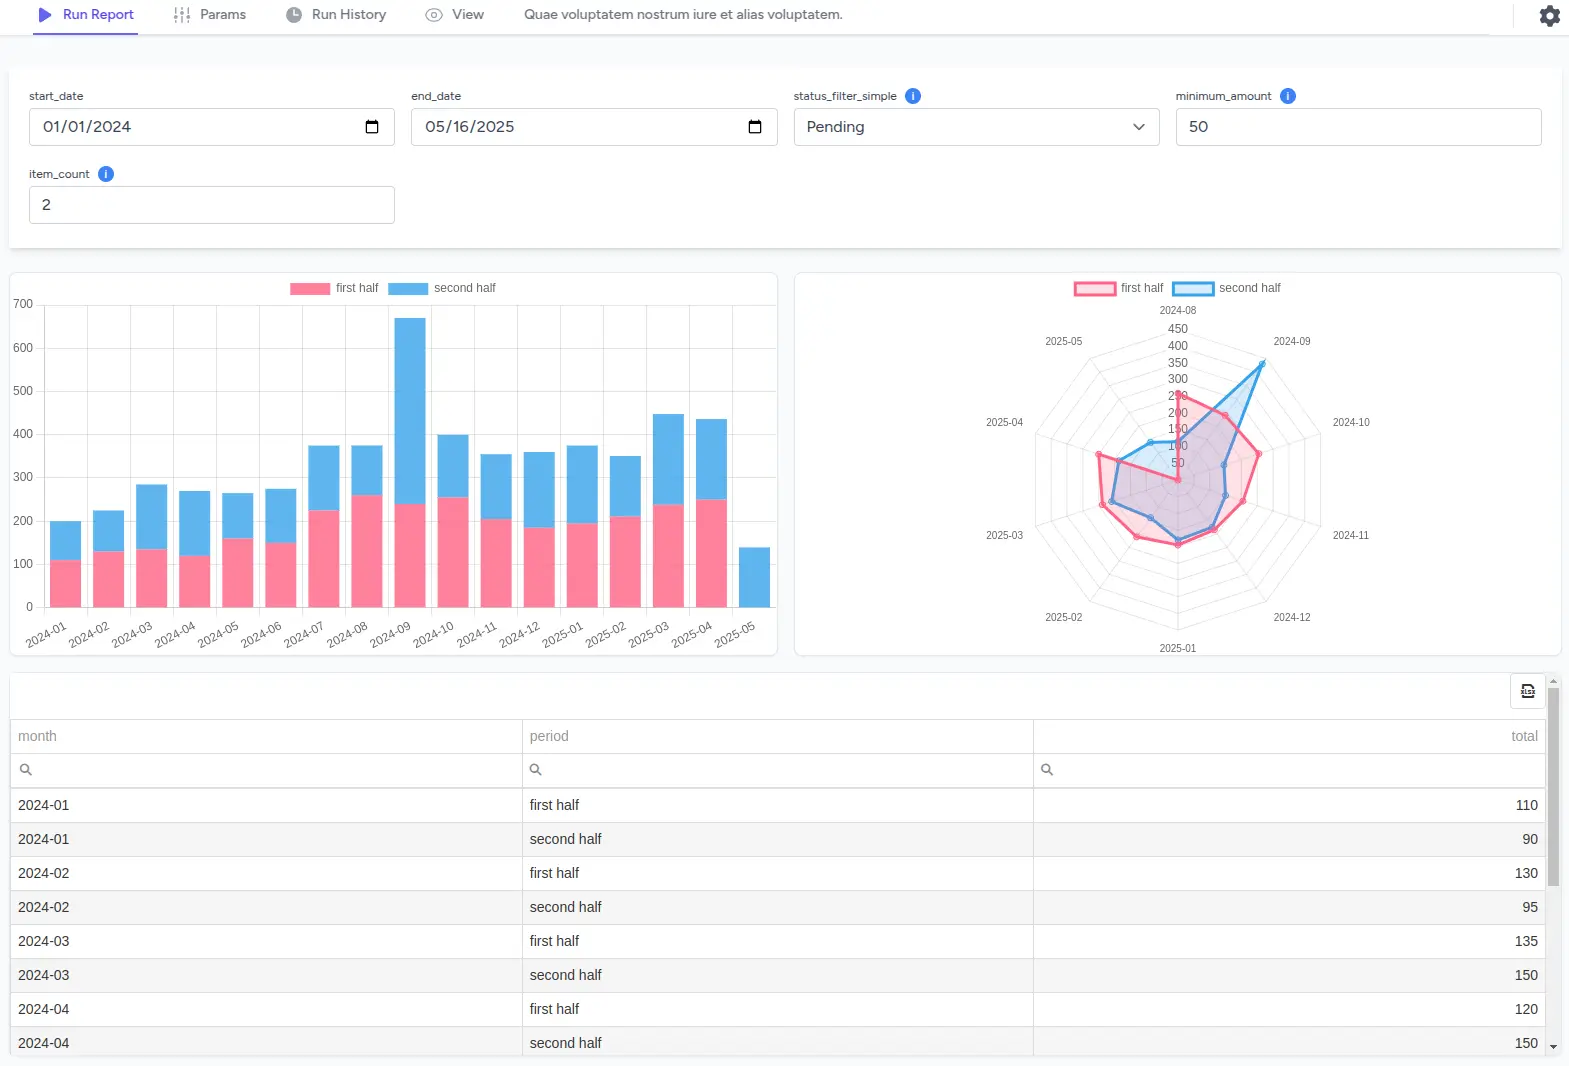
Write, run, and manage SQL queries in an intuitive interface. View results, use parameters, and inspect the rendered SQL.
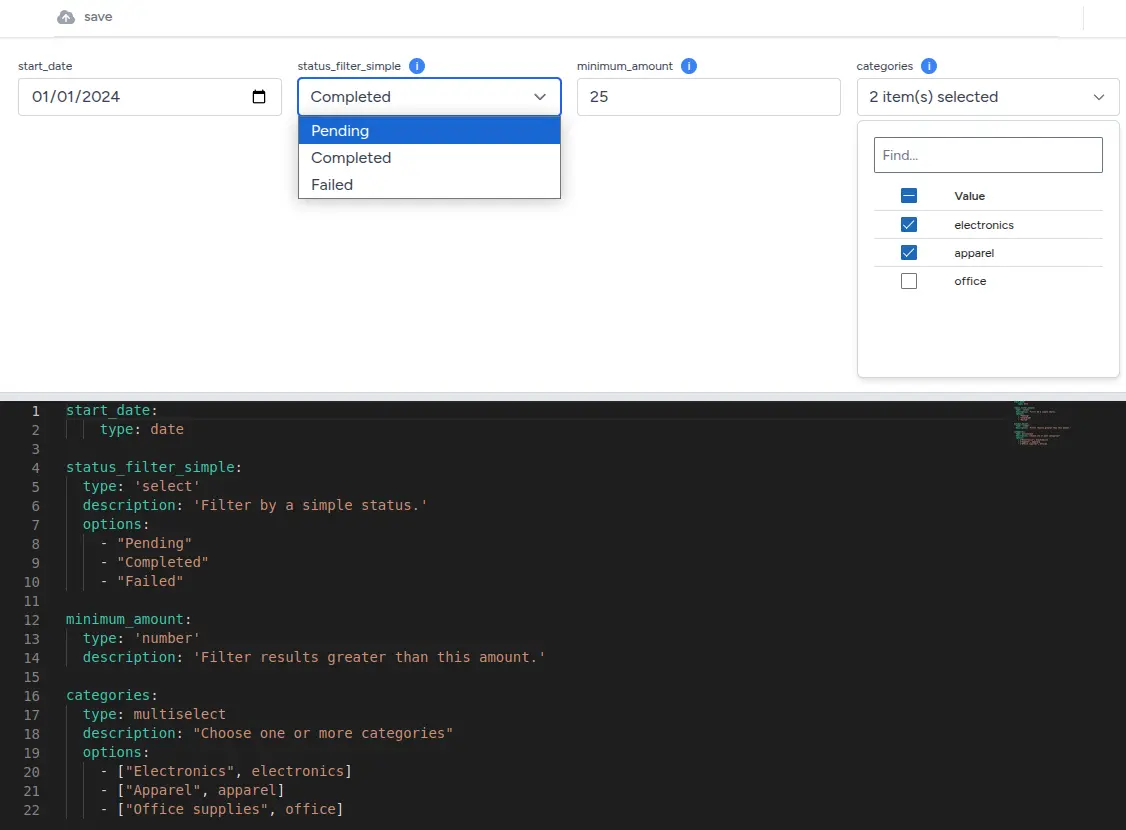
Set Up Dynamic Params
Define interactive parameters using YAML to make your reports dynamic. Use Liquid templating to inject these parameters into your queries.
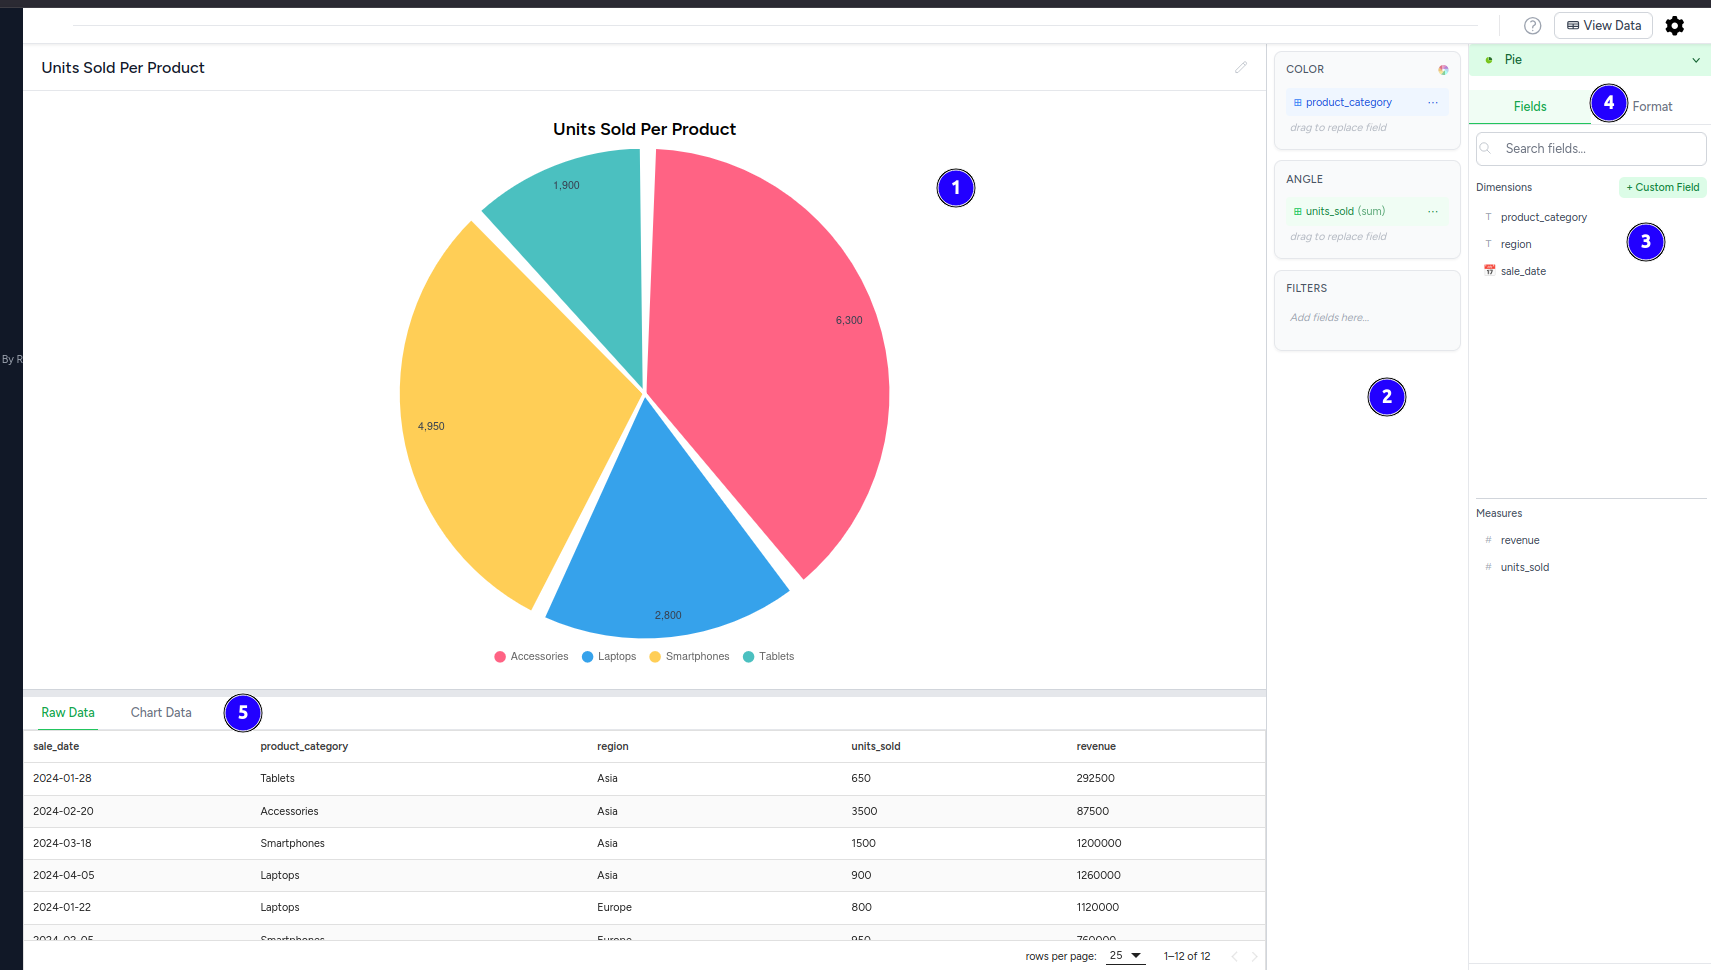
Build Charts
Visualize query results with various chart types, pivot tables, and data grids. Configure by dragging fields and customizing their display.
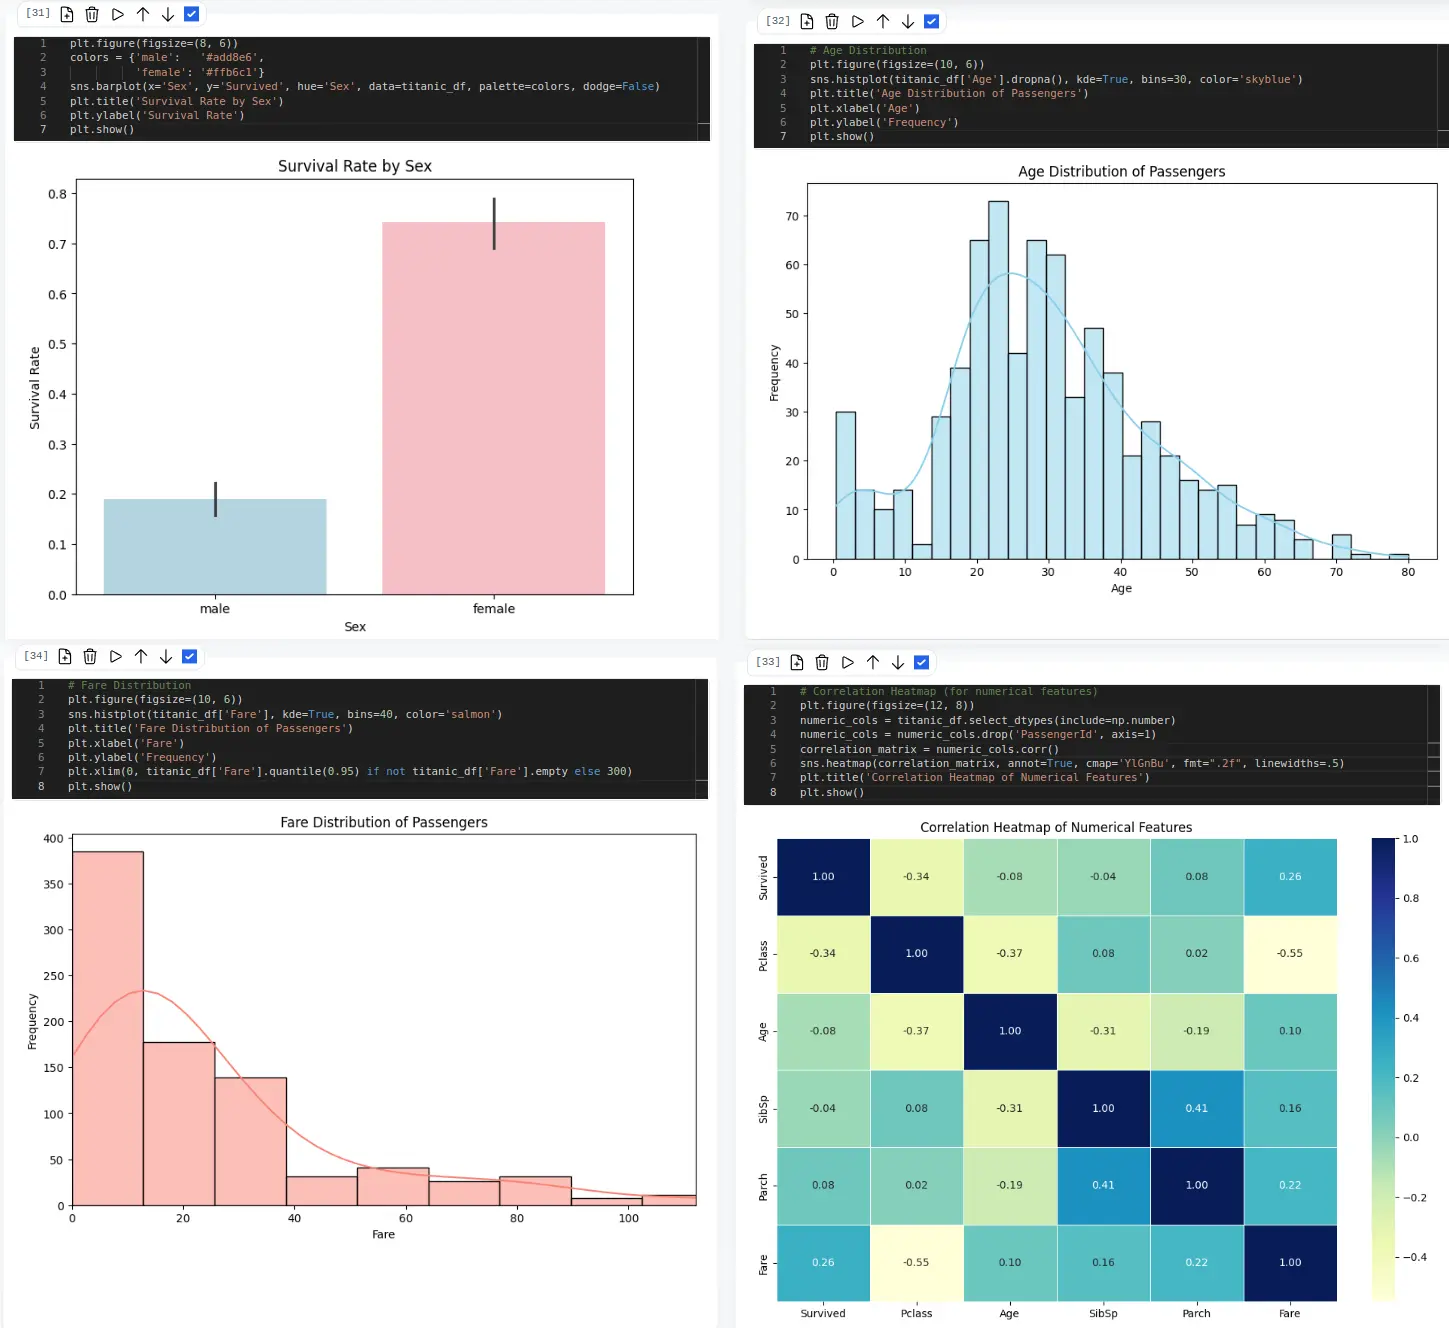
Post-Process Data With Python Notebooks
Use embedded Python notebooks to explore data, run analyses with pandas, and visualize results with libraries like Matplotlib. Add notebook cell outputs directly to your reports.
Build your Final Report
Assemble charts and notebook outputs into comprehensive reports. In edit mode, arrange elements, set their size, and customize the layout.
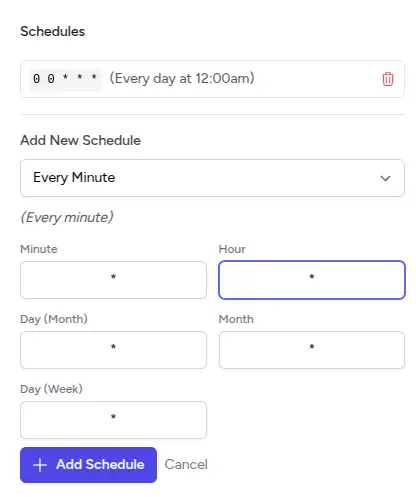
Schedule Runs and Set up Alerts
Schedule report/query runs to keep data fresh and relevant.
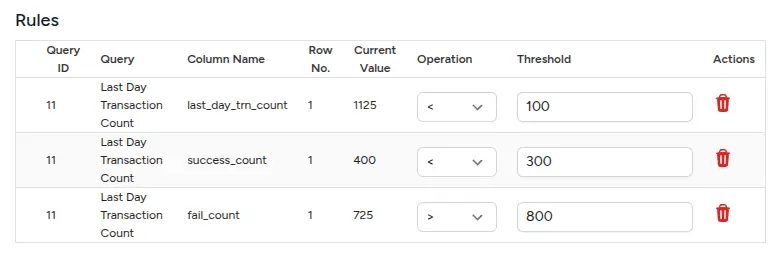
Monitor key metrics and get notified when specific conditions are met. Define rules based on query results and set cooldown periods to manage notification frequency.
API
Extend PyQueryHub's capabilities and integrate reports externally.
Report Embedding
Securely embed reports into your applications using a two-token system: a long-lived Personal API Token and a short-lived Report Access Token for iframe embedding.
<iframe src="https://pyqueryhub.com/api/reports/REPORT_ID_HERE/view/shortLivedRandomStringTokenValueGeneratedByTheApi"
        width="100%"
        height="600px"
        frameborder="0"
        title="Embedded Report Name">
</iframe>