Report Builder - Create Interactive Dashboards
The Report Builder allows you to create comprehensive, interactive dashboards by combining charts, data grids, notebook outputs, and text widgets into a unified report layout. Build professional reports that can be shared, exported, and embedded.
Accessing the Report Builder
Navigation Options
- From Report View: Click the "Edit Report" option in the view mode menu (three dots)
- Direct URL: Navigate to
/reports/{id}?builder=1to access the builder directly - From Collections: Create a new report and add charts/notebooks to it
Edit vs View Modes
Edit Mode:
- Full editing capabilities with drag-and-drop functionality
- Add, remove, and configure report elements
- Resize and reposition components
- Access to all builder tools and controls (+ Text, Clean Rows, Settings)
View Mode:
- Read-only presentation view of the final report
- Clean interface optimized for stakeholders
- Export options (PDF, image, thumbnail generation)
- Optional parameter controls for interactive reports
Adding Content to Your Report
Charts and Data Visualizations
From Chart Builder:
- Navigate to any chart in your report
- Right-click on the chart name in the sidebar
- Select "Add to Report Builder" from the context menu
- Chart appears in your report dashboard
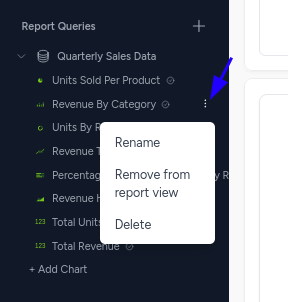
Chart Types Supported:
- Bar, Line, Area, and Pie charts
- Scatter plots and radar charts
- Data grids and pivot tables
- Big number widgets
- All chart types from the Chart Builder
Notebook Outputs
From Notebook Cells:
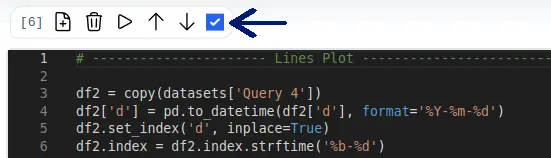
- Open the Notebook tab in your report
- In any cell, toggle "Add to Report Builder"
- Cell output (tables, plots, images) appears in the report
Notebook Content Supported:
- HTML tables from pandas DataFrames
- Matplotlib/Seaborn plots and visualizations
- Custom HTML output from notebook cells
- Text and markdown content
Text Widgets
Adding Text Components:
- Click the "+ Text" button in the header toolbar
- Add formatted text, headings, and descriptions
- Support for rich text formatting
- Perfect for report titles, explanations, and context
Report Layout and Design
Grid-Based Layout System
The Report Builder uses a responsive grid system for organizing content:
- Drag-and-Drop Interface: Components can be dragged and repositioned within the grid layout
- Flexible Sizing: Charts and widgets can be resized using drag handles on component edges
- Mobile Responsive: Reports adapt to different screen sizes automatically
- Visual Grid Guidelines: Grid lines appear during drag operations to help with alignment
Dashboard Styling
Reports use a professional dashboard layout inspired by modern analytics platforms:
- Clean, card-based design for each component
- Consistent spacing and typography
- Professional color schemes and styling
- Optimized for both desktop and mobile viewing
Component Management
Resizing Elements:
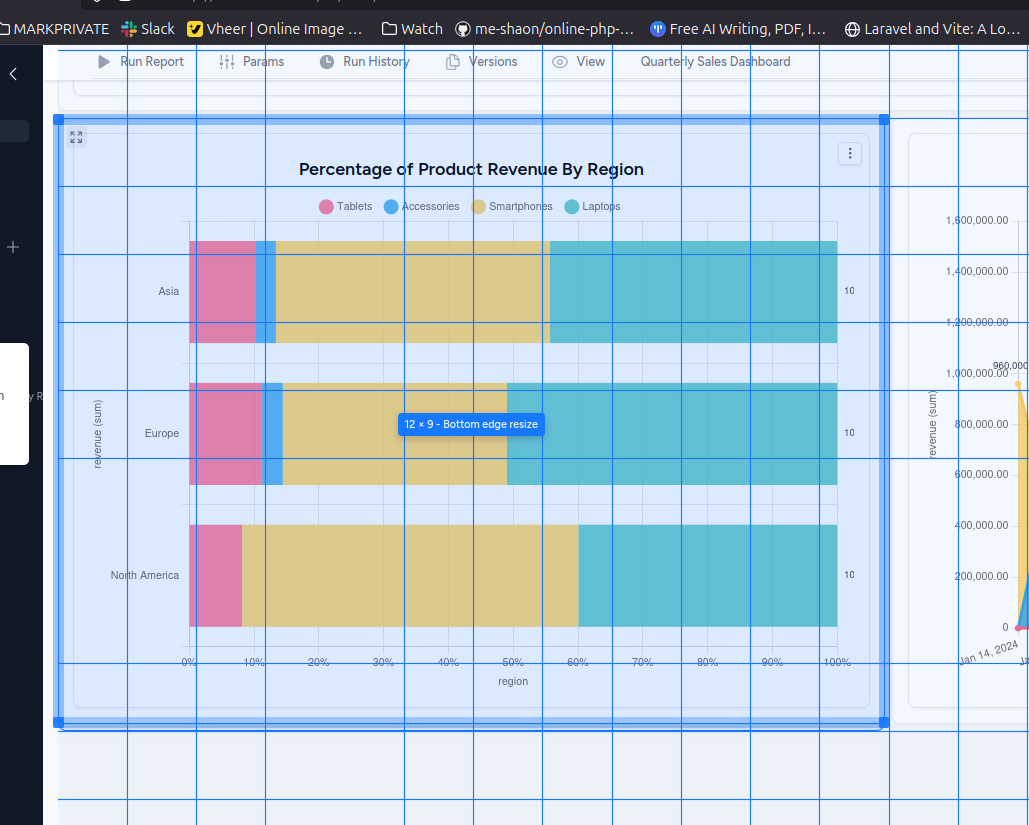
- Click and drag the blue resize handles on the edges and corners of any component
- Components can be resized both horizontally and vertically
- Real-time tooltip shows the current size (e.g., \"12 × 9 - Bottom edge resize\")
- Grid guidelines help with precise positioning
- Components maintain their content and aspect ratios while being resized
Moving Elements:
- Click and hold any component to start dragging
- Grid guidelines appear to help with positioning
- Components snap to grid positions for perfect alignment
- Drop zones highlight when hovering over valid positions
Cleaning Up Your Report
Layout Management:
- Clean Rows button (red) in the toolbar removes empty grid sections automatically
- Detects and removes unused whitespace between components
- + Text button (blue) adds text widgets for headings, descriptions, and context
- Settings gear icon provides additional layout and configuration options
Parameters and Interactivity
Parameter Integration
Reports can include interactive parameters that affect all connected charts and queries:
- Parameter Panel: Collapsible parameter controls at the top of reports
- Real-time Updates: Changes to parameters automatically refresh affected components
- Cross-Component Filtering: Parameters affect multiple charts simultaneously
- Parameter Persistence: Parameter values are maintained across report sessions
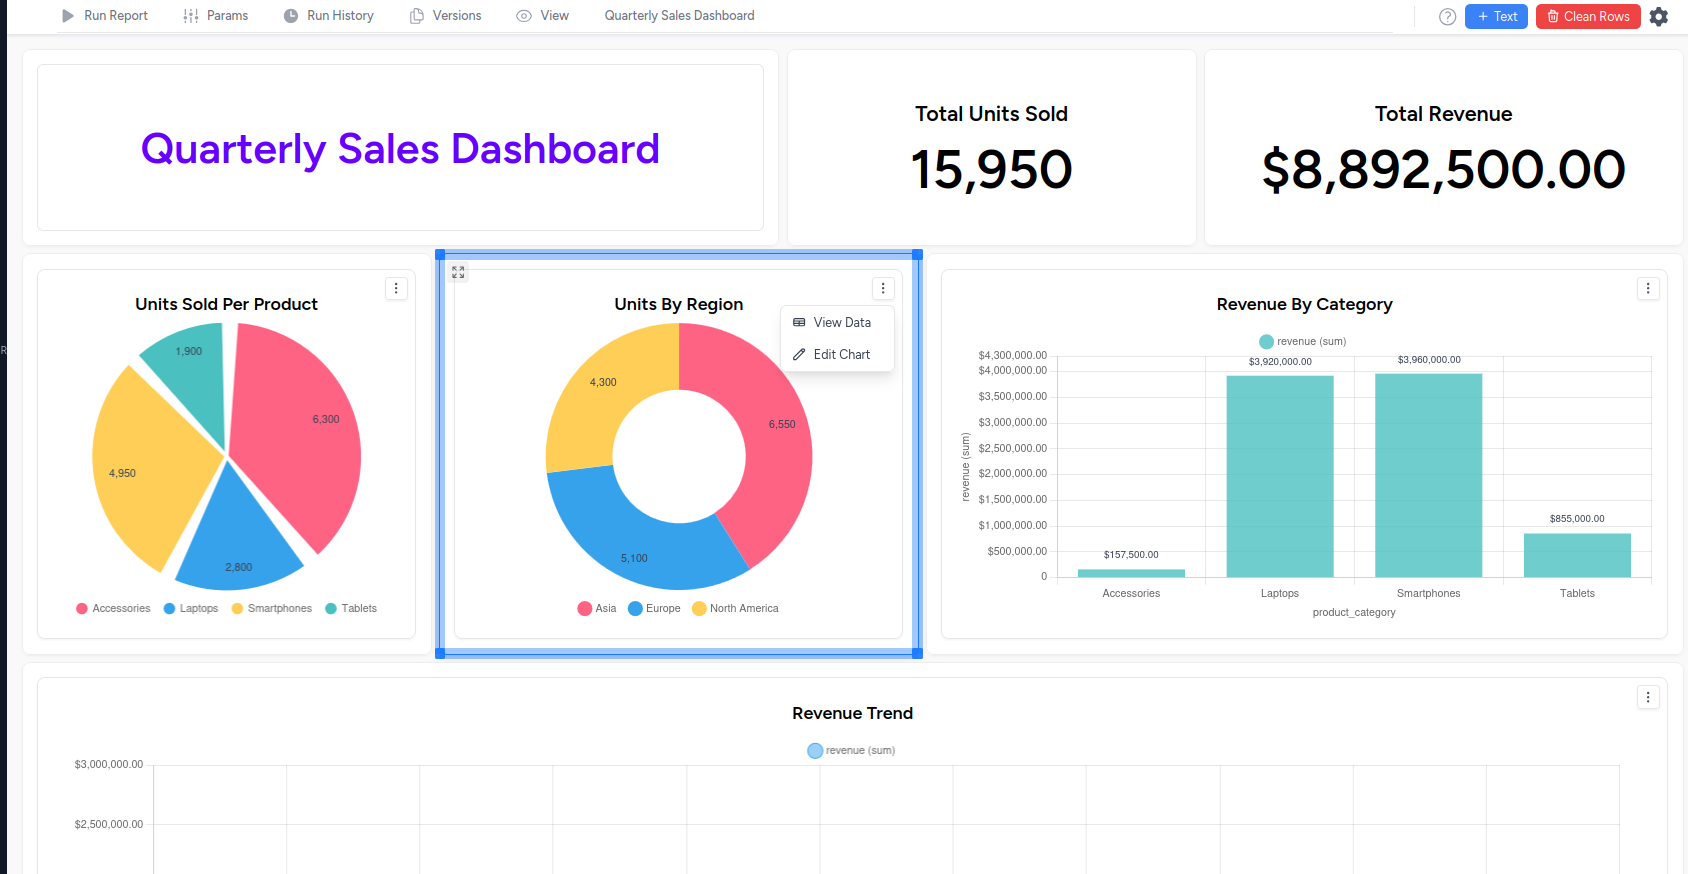
Interactive Features
- Dynamic Content: Charts and tables update based on parameter changes
- Data Viewing: Click "View Data" on any chart to see underlying data in a modal table
- Data Export: Export underlying chart data as CSV directly from the data view modal
- Drill-down Capability: Click on chart segments to filter data and see detailed breakdowns
- Cross-Component Filtering: Drill-down actions can affect multiple charts simultaneously
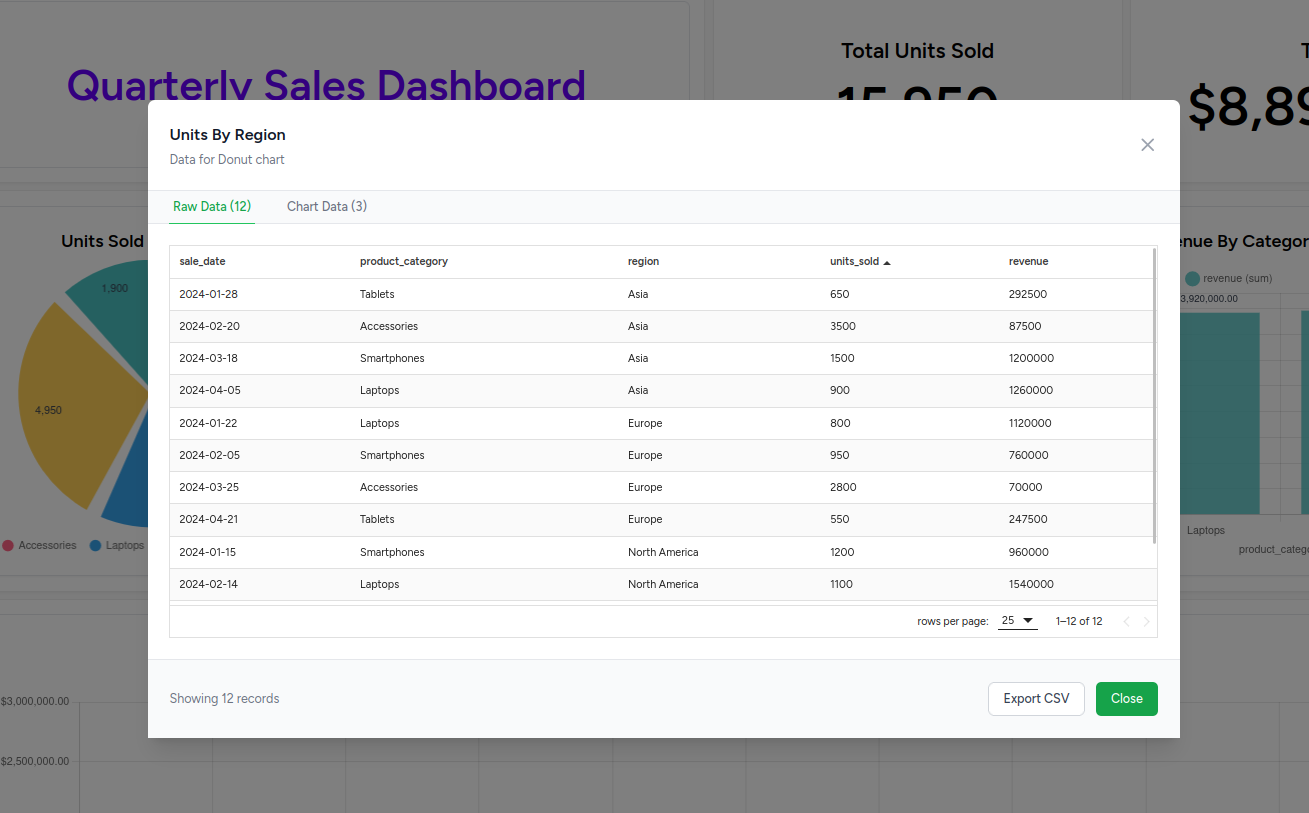
Chart Drill-Down Functionality:
Charts in the Report Builder support interactive drill-down capabilities:
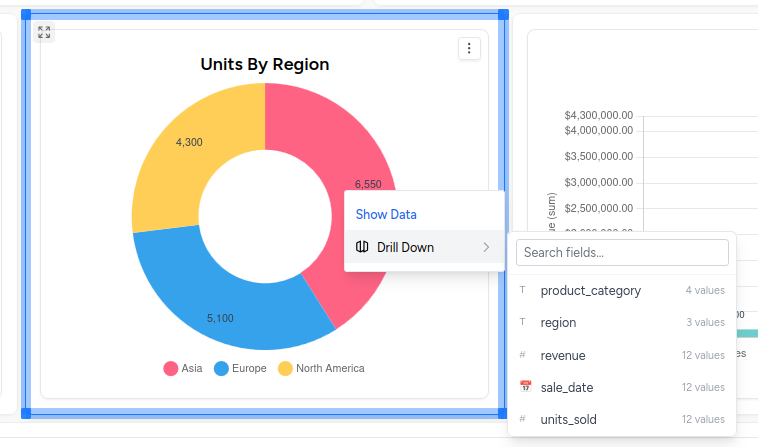
- Click Chart Segments: Right-click on any chart segment (pie slice, bar, data point) to access drill-down options
- Context Menu: Select \"Drill Down\" from the context menu that appears
- Show Data: Use \"Show Data\" to view the underlying data for that segment
- Field Selection: Choose which fields to drill down by from the available options
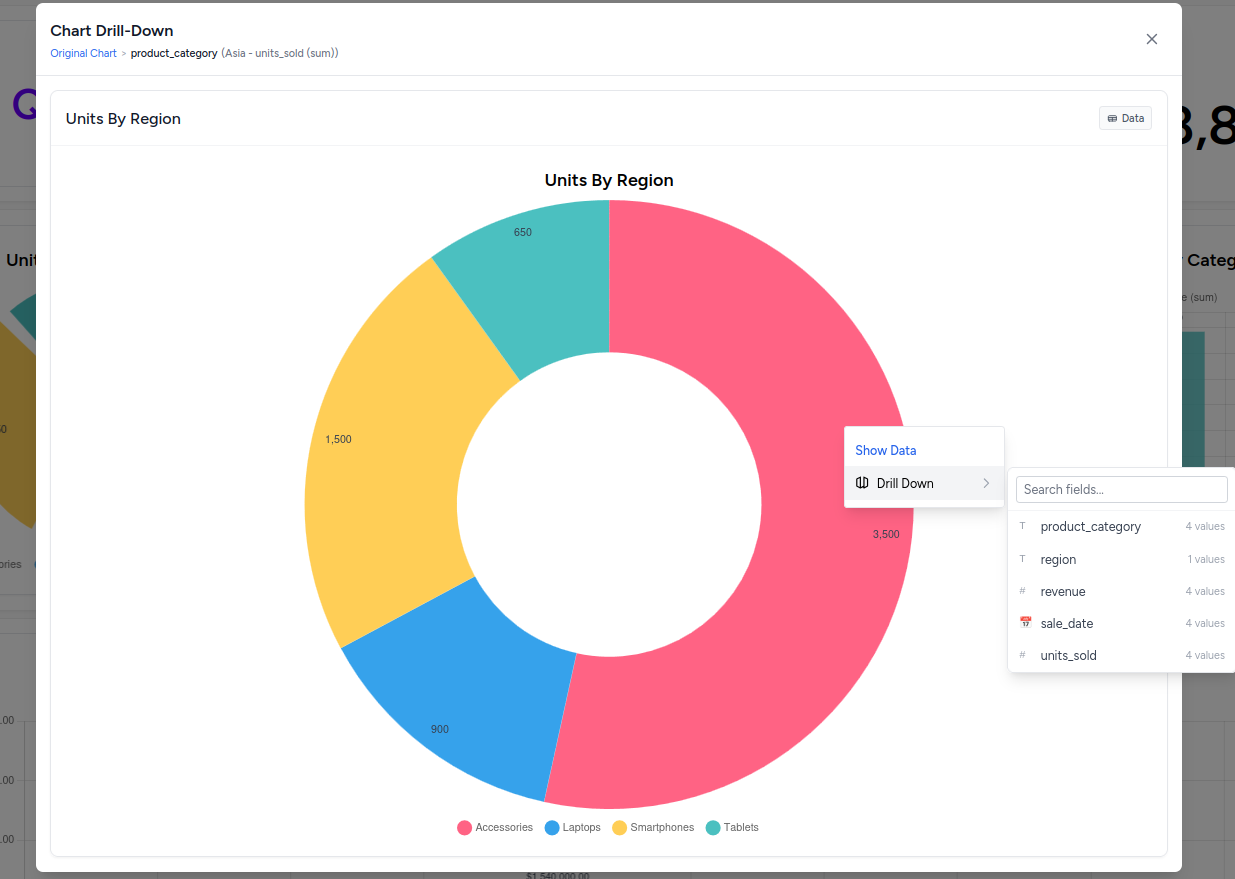
Drill-Down Modal Features:
- Chart Drill-Down Header: Shows the original chart name and applied filters
- Filtered Chart: Displays a new chart with data filtered based on your selection
- Field Filtering Panel: Right sidebar with available fields and their value counts
- Data Tab: Switch to \"Data\" tab to see the raw filtered data
- Search Fields: Search through available filter fields
- Multiple Drill-Downs: Continue drilling down further by clicking on the new chart segments
Report Execution and Performance
Report Running
Manual Execution:
- "Run Report" button executes all queries and refreshes all components
- Progress indicators show execution status
- Error handling for failed queries or components
Automatic Updates:
- Parameters trigger automatic updates when changed
- Scheduled reports can run automatically
- Real-time data refresh for connected components
Performance Optimization
- Lazy Loading: Components load as needed for better performance
- Caching: Query results and chart data are cached appropriately
- Responsive Design: Optimized rendering for different screen sizes
Export and Sharing Options
Export Formats
Available in View Mode through the context menu (three dots):
Image Export:
- Download high-quality screenshots of the entire report
- PNG format optimized for presentations and documents
- Full-resolution captures of all report components
PDF Export:
- Professional PDF documents with preserved formatting
- Multi-page support for long reports
- Print-optimized layouts and styling
Thumbnail Generation:
- Create preview thumbnails for report collections
- Automated thumbnail generation for report listings
- Used in collection views and report galleries
Sharing and Collaboration
- View Mode URLs: Share read-only report URLs with stakeholders
- Permission-Based Access: Control who can edit vs view reports
- Embedding: Reports can be embedded in external applications via API
- Collection Organization: Group reports within collections for team access
Version Management
The Report Builder includes comprehensive version control for tracking report changes:
Creating Versions
- Versions Tab: Access version management through the "Versions" tab in the top navigation
- Save Current State: Create snapshots of your report at any point in development
- Version Naming: Add descriptive names and notes for each version
- Automatic Timestamps: Each version is automatically timestamped for tracking
Version History Modal
The Version History provides comprehensive version management:
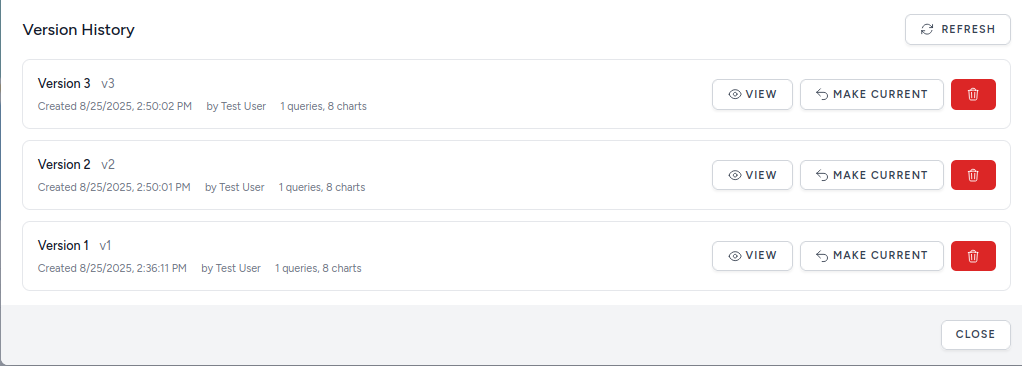
- Version Listing: All versions displayed with version numbers (v1, v2, v3)
- Creation Details: Shows creation date, time, and creator (\"by Test User\")
- Component Count: Displays number of queries and charts in each version
- Action Buttons:
- VIEW: Preview the version in read-only mode
- MAKE CURRENT: Restore this version as the active report
- Delete (trash icon): Remove versions no longer needed
- Refresh: Update the version list with latest changes
Viewing Previous Versions
- Version History: Browse through all saved versions of your report
- Side-by-Side Comparison: Compare different versions to see changes
- Restore Functionality: Use \"MAKE CURRENT\" to revert to any previous version
- Read-Only Preview: View historical versions without affecting the current report

Advanced Features
Report Builder Toolbar
Edit Mode Tools:
- Run Report: Execute all queries and refresh all components
- Params: Access parameter controls that affect the entire report
- Run History: View execution history and performance metrics for all report components
Run History
Reports maintain comprehensive execution history:
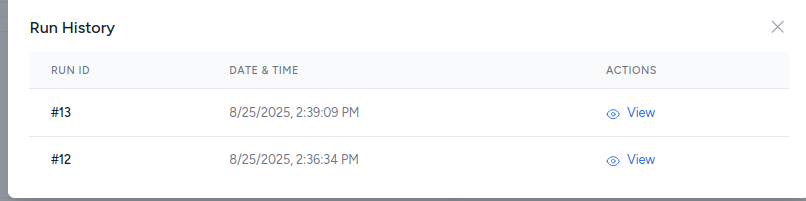
- Historical Tracking: View previous report executions with timestamps
- Run ID Tracking: Each execution gets a unique ID for reference
- View Results: Click \"View\" to see the results from any previous run
- Performance Monitoring: Track execution patterns and identify performance issues
- Versions: Create and manage report versions
- View: Switch to read-only presentation mode
- + Text: Add text widgets and annotations to your dashboard
- Clean Rows: Remove empty grid sections and optimize layout
- Settings: Access advanced report configuration options
Component Options
Each report component includes:
- Resize Handles: Visual controls for adjusting component size
- Context Menus: Right-click options for component-specific actions
- Error Handling: Clear error messages for failed components
- Loading States: Visual feedback during component updates
Layout Management
- Responsive Grid: Automatic layout adaptation for different screen sizes
- Component Ordering: Visual hierarchy and logical flow of information
- Whitespace Management: Proper spacing and alignment of components
- Professional Styling: Consistent design system across all components
Best Practices
Report Design
- Clear Hierarchy: Use text widgets to create section headings and provide context
- Logical Flow: Arrange components in a logical reading order using drag-and-drop
- Consistent Styling: Maintain consistent chart colors and formatting across components
- Interactive Elements: Leverage drill-down capabilities for deeper data exploration
- Version Control: Create versions at major milestones to track report evolution
Performance
- Optimize Queries: Ensure underlying queries are efficient
- Limit Components: Balance comprehensiveness with load times
- Cache Strategy: Use appropriate caching for frequently accessed reports
- Mobile Consideration: Test report layout on different screen sizes
Collaboration
- Clear Naming: Use descriptive names for reports and components
- Documentation: Include text widgets to explain complex visualizations and analysis
- Version Control: Use the version management system to track changes and collaborate effectively
- Data Transparency: Provide "View Data" access so stakeholders can explore underlying data
- Export Capabilities: Enable data export for further analysis outside the platform
Troubleshooting
Common Issues
- Components Not Loading: Check underlying query and chart configurations
- Drag-and-Drop Problems: Ensure you're clicking on the component itself, not empty space
- Layout Problems: Use "Clean Rows" to fix empty sections and optimize spacing
- Parameter Issues: Verify parameter definitions in the Params tab
- Version Conflicts: Check version history if unexpected changes appear
- Export Failures: Ensure all components are loaded before exporting data or images
Getting Help
- Component Errors: Check individual chart and query configurations
- Layout Issues: Use drag-and-drop, resize handles, and "Clean Rows" effectively
- Interactive Features: Test drill-down functionality by clicking on chart segments
- Version Management: Use version control to recover from unwanted changes
- Data Access: Use "View Data" feature to verify underlying data is correct
- Performance Problems: Optimize underlying queries and reduce report complexity
For more information on creating the underlying content: