Notebooks Module
The Notebook feature provides an interactive Python environment embedded within each report. Use it to explore parameters, inspect query results, visualize data, and push outputs back into your final report—no local Python setup required.
Accessing the Notebook
- Open your report and click the Notebook tab.
- You’ll see a toolbar at the top and a series of code cells below.
Working with Cells
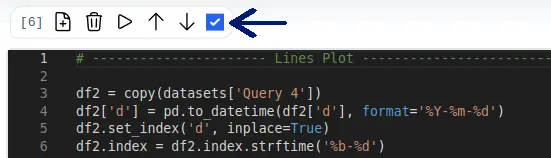
Notebooks consist of cells (code + output blocks):
- Add a cell: Click the ➕ icon between cells to insert a new blank cell.
- Delete a cell: Click the 🗑️ icon on a cell and confirm to remove it.
- Reorder: Use the ↑/↓ arrows to move a cell up or down.
Running Code
- Run cell: Click ▶️ on an individual cell to execute only that cell.
- Run All: Click Run All in the toolbar to execute every cell in order and automatically save outputs.
- Execution count: Each run increments the counter so you can track execution order.
AI-Powered Code Generation
PyQueryHub includes an intelligent AI assistant that can generate Python code for your notebook cells based on natural language descriptions:
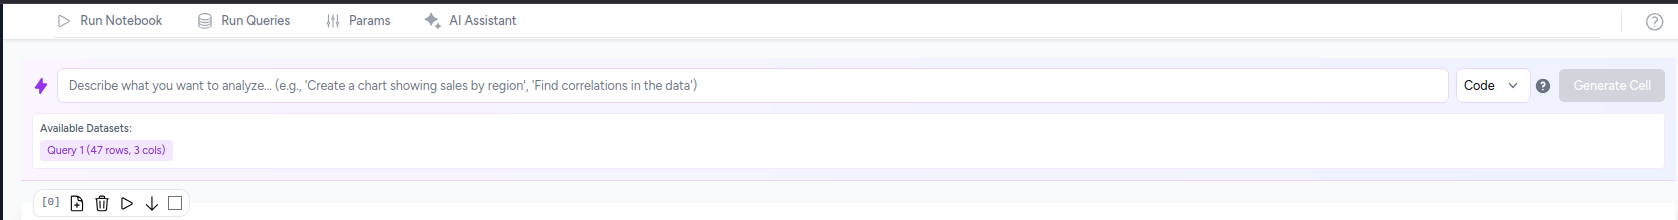
Using the AI Assistant:
- Click the AI Assistant button in the notebook toolbar
- Describe what you want to analyze in plain English (e.g., "Create a chart showing sales by region", "Find correlations in the data")
- The AI will generate Python code that's automatically added to the last cell in your notebook
- The generated code is context-aware and uses your available datasets and parameters
- Run the cell to execute the AI-generated code immediately
AI Assistant Features:
- Context awareness - Knows all available variables from your datasets and parameters
- Dataset integration - Automatically references your query results and DataFrames
- Parameter access - Can use values from your report's parameter configuration
- Library optimization - Generates code using available Python packages (pandas, matplotlib, seaborn, etc.)
- Visualization ready - Creates charts and plots that render inline in your notebook
- Data analysis - Performs statistical analysis, correlations, and data exploration
Example prompts:
- "Show a bar chart of sales by product category"
- "Calculate correlation between revenue and units sold"
- "Create a time series plot of monthly trends"
- "Find the top 10 customers by total revenue"
- "Generate summary statistics for all numeric columns"
Available Context: The AI assistant has access to:
- datasets - All query results as pandas DataFrames
- ParamsObject - Your report's parameter values
- Available functions -
print_df(),run_query(), and all Python/pandas methods - Installed packages - pandas, numpy, matplotlib, plotly, scikit-learn, and more
Preloaded Data
On load, the Notebook initializes a Pyodide environment and injects data from your report:
-
ParamsObject: Access and pretty‑print your report’s parameters:
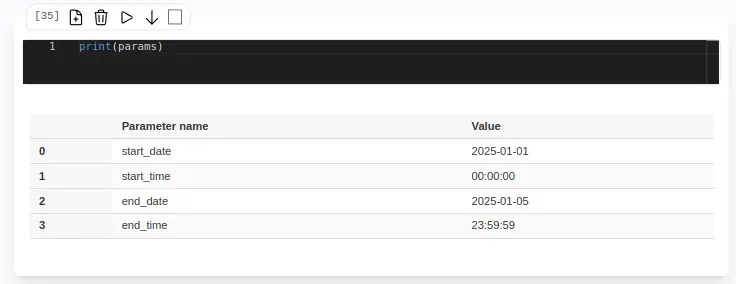
If You edit parameters in the Parameters tab, click on
Run Queriesto see changes reflected in both params and dataset content. -
DataFrameContainer: Wraps your query results as pandas DataFrames, complete with row/column counts:
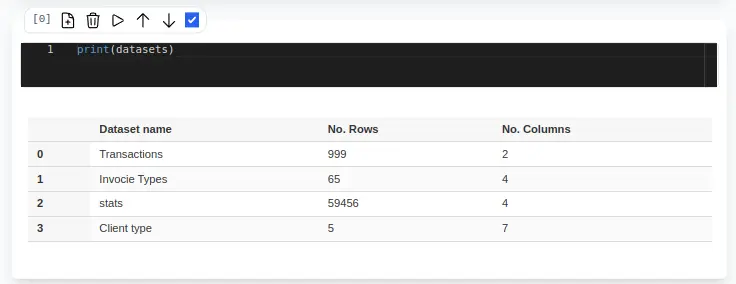
These helpers render as HTML tables and images directly in the notebook.
Inspecting Query Results
Your report’s queries run before the notebook loads and are passed in via the datasets variable. Example:
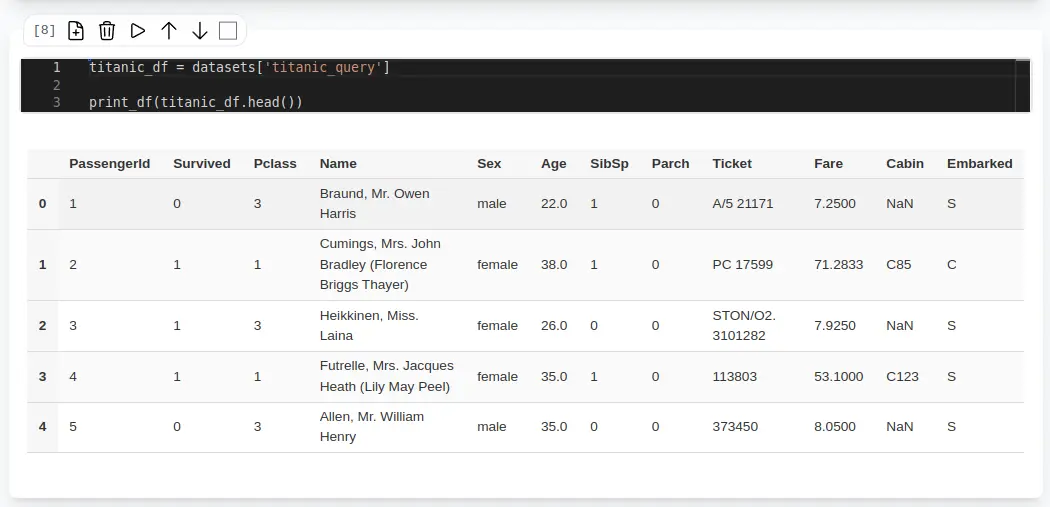
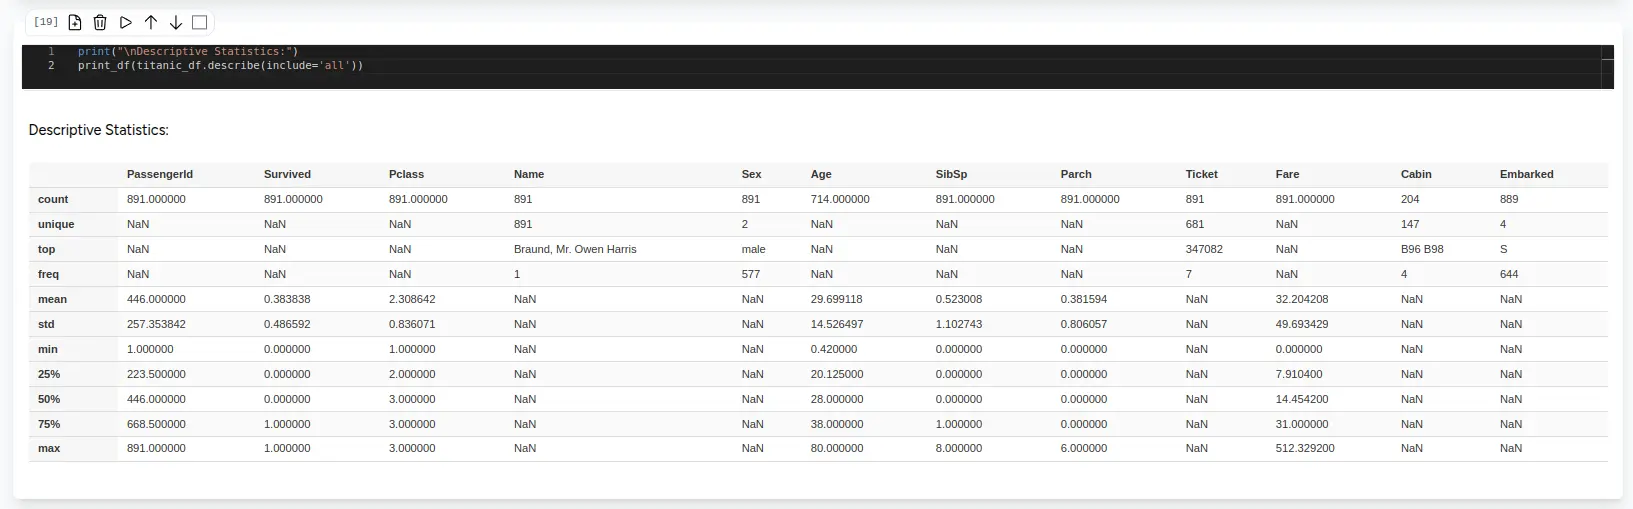
Use print_df to display a DataFrame in the notebook. You can also use df.head() to show the first few rows of any DataFrame.
Adding Outputs to Your Report
Toggle Add to Report Builder on any cell to include that cell’s final output (HTML table or image) in your report when saving. This lets you mix narrative text with live data insights.
Sending Alerts from Notebooks
You can send notifications directly from a notebook cell using the built-in send_alert() function. This lets you trigger alerts to any configured channel (Slack, Discord, Telegram, Email) based on your data analysis.
Usage
send_alert(channel, title, text, level)Parameters
| Parameter | Type | Required | Description |
|---|---|---|---|
channel |
string | Yes | The channel alias to send the alert to (e.g., 'slack', 'discord', 'telegram', 'email') |
title |
string | No | The alert title |
text |
string | Yes | The alert message content |
level |
string | No | Severity level: 'info', 'success', 'warning', or 'error' (default: 'info') |
Examples
Simple alert:
send_alert('slack', 'Daily Report', 'All metrics are within normal range.', 'success')Data-driven alert:
df = datasets["sales_query"]
total = df["revenue"].sum()

if total < 10000:
    send_alert('discord', 'Revenue Alert', f'Daily revenue is ${total:,.2f}, below the ,000 threshold.', 'warning')
else:
    send_alert('slack', 'Revenue Update', f'Daily revenue: ${total:,.2f}', 'success')
Multiple channels:
message = f'Found {len(anomalies)} data anomalies in the latest batch.'
send_alert('slack', 'Data Quality', message, 'error')
send_alert('email', 'Data Quality', message, 'error')
Note: Channels must be configured before use. See Channels for setup instructions. When combined with Query Scheduling, you can automate notebook execution and send alerts on a recurring basis.
Under the Hood
-
Available functions:
print_df: Will output the pandas dataframe in a html table.run_query(query, db_connection_name): Will run a query and return the results as a pandas dataframe.send_alert(channel, title, text, level): Send a notification to a configured channel.
-
Available Python Packages: Pyodide Comes by default with a set of packages, including:
pandasnumpymatplotlibscikit-learnstatsmodelsplotly
- Check all available packages in the Pyodide documentation.
-
Some Packeges (like
seasborn) are not available by default. You can install them usingmicropipin your notebook. For example, to installseaborn, run:
import micropip
await micropip.install(['seaborn'])
Example Code Snippet
Pandas Stats
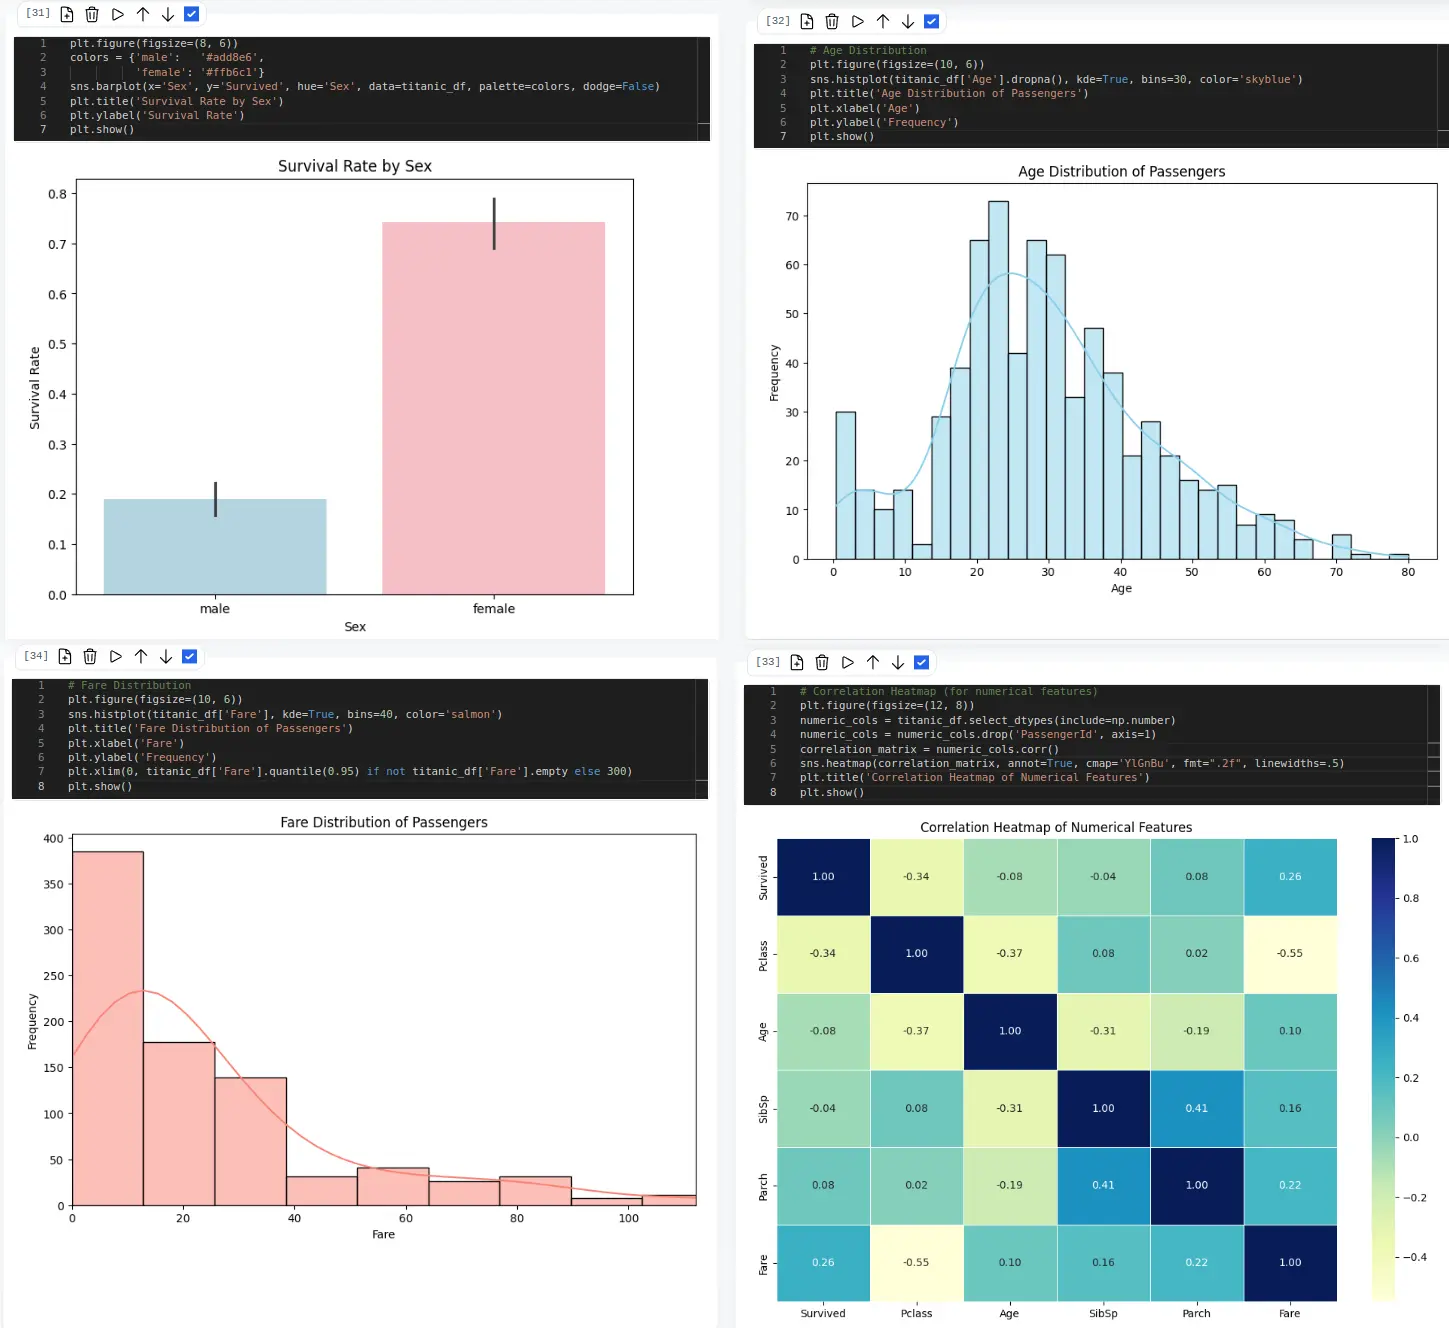
Example Plot With Matplotlib and Seaborn
Best Practices
- Focus: Keep each cell to a single purpose—data inspection, plotting, or parameter testing.
- Re‑run Queries: After updating parameters in the Parameters tab, click Run Queries to refresh data.
- Visualize: Use matplotlib to chart results; plots render inline thanks to a custom
plt.show()hook.
Start experimenting with live Python in your reports today—your data, your code, your insights, all in one place!