Chart Drill-Down
The Chart Drill-Down feature allows you to explore your data in greater depth by clicking on chart segments and creating filtered views of your data. This powerful feature enables progressive data exploration, letting you navigate from high-level overview charts down to detailed, filtered datasets.
Overview
Chart drill-down provides an interactive way to:
- Explore data hierarchically - Start with broad categories and drill into specific segments
- Apply progressive filtering - Each drill-down level adds new filters to narrow your data scope
- Navigate between levels - Use breadcrumb navigation to move between drill-down levels
- Analyze filtered datasets - Each level shows a complete chart based on filtered data
- Export filtered data - Access underlying data at any drill-down level
Accessing Drill-Down
From Report Builder
When viewing charts in the Report Builder, right-click on any chart segment (bar, pie slice, data point) to access the drill-down menu:
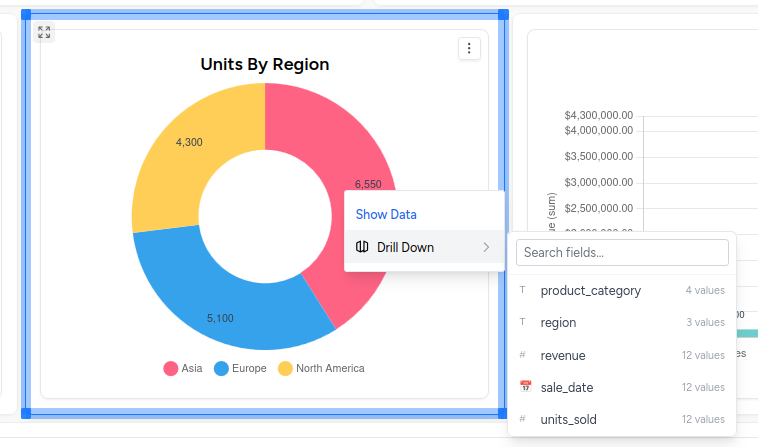
The context menu provides options to:
- View Underlying Data - See the raw data for the selected segment
- Export Data - Export the segment's data to various formats
- Drill-Down - Select a field to drill down into for deeper analysis
From Individual Charts
The drill-down feature is also available when viewing individual charts outside of the report builder context.
Drill-Down Process
1. Initiating Drill-Down
Right-click on any chart segment:
- Bar Charts - Click on any bar segment
- Pie Charts - Click on any pie slice
- Line Charts - Click on any data point
- Stacked Charts - Click on any stack segment
Select "Drill-Down" from the context menu
Choose your drill-down field:
- Select from available fields in your dataset
- Fields are filtered to exclude custom/calculated fields
- Available fields include dimensions, measures, and other categorical data
2. Drill-Down Modal
Once you select a drill-down field, the drill-down modal opens with a full-screen chart view:
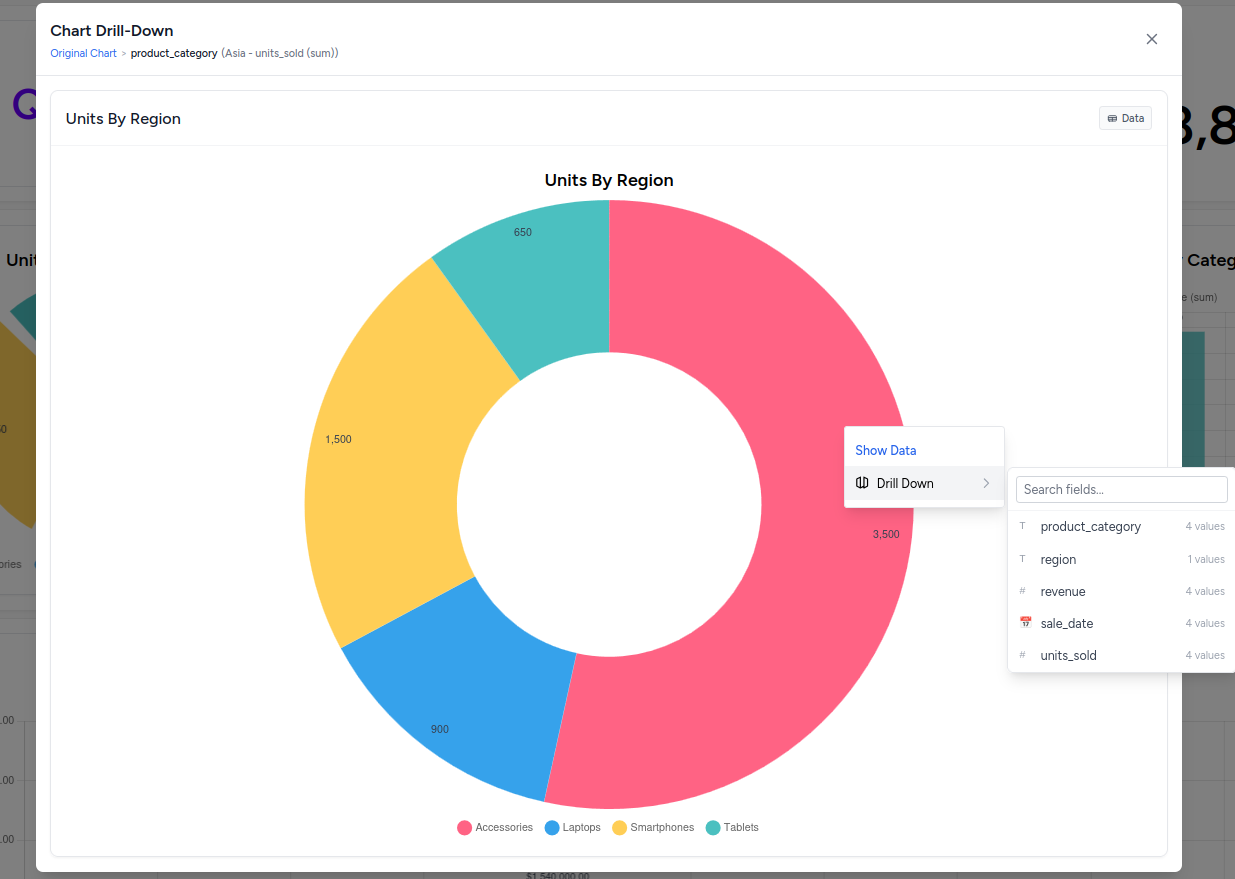
Modal Features:
- Full-screen chart display - Large, detailed view of your filtered data
- Breadcrumb navigation - Navigate between drill-down levels
- Interactive chart - Continue drilling down further within the modal
- Close button - Return to the original view
3. Breadcrumb Navigation
The breadcrumb navigation shows your current path through the drill-down levels:
Navigation Elements:
- "Original Chart" - Returns to the base chart without any drill-down filters
- Level breadcrumbs - Each intermediate level shows:
- Field name used for that level
- Segment value that was selected (in parentheses)
- Current level - Non-clickable, shows your current position
Example breadcrumb path:
Original Chart > product_category (Electronics) > brand (Apple) > model (Current Level)How Drill-Down Works
Data Filtering
Each drill-down level applies progressive filters to your original dataset:
Level 0 (Original): All data, no filters
Level 1: Data filtered by first selection (e.g., product_category = 'Electronics')
Level 2: Data filtered by first + second selection (e.g., product_category = 'Electronics' AND brand = 'Apple')
Level 3: Data filtered by all previous selections + third selection
Chart Configuration
At each drill-down level:
For regular charts (Bar, Line, Area):
- The selected drill-down field becomes the new Group field
- Chart displays data grouped by the new field
- All other chart settings remain the same
For Pie/Donut charts:
- The selected drill-down field becomes the new Dimension field
- Group fields are cleared (pie charts don't use grouping)
- Chart shows distribution of the new field
Date Field Handling
When drilling down on date fields, the system:
- Preserves date formatting - Uses the same date format as the original chart
- Handles date grouping - Respects year, month, quarter, week settings
- Supports year-based filtering - Can filter by extracted year values for date ranges
Advanced Features
Multi-Level Drill-Down
You can drill down multiple levels deep:
- Start from any chart segment
- Select first drill-down field (e.g., "region")
- Within the modal, right-click another segment
- Select second drill-down field (e.g., "product_category")
- Continue drilling as needed
Each level maintains all previous filters while adding new ones.
Field Selection Intelligence
The drill-down system automatically:
Excludes inappropriate fields:
- Custom/calculated fields (prefixed with "custom" or "calculated")
- Fields that don't provide meaningful drill-down options
Prioritizes relevant fields:
- Dimension fields from your chart configuration
- Group fields from your chart configuration
- Value fields (non-aggregated versions)
- Other categorical fields from your dataset
Provides field information:
- Field type detection (text, number, date)
- Unique value counts for each field
- Alphabetical sorting of available fields
Data Export at Any Level
At any drill-down level, you can:
- Export the filtered dataset - Get CSV/Excel of the current filtered data
- View underlying data - See the raw records that make up the current chart
- Access chart data - View the processed, aggregated data used for visualization
Supported Chart Types
Drill-down functionality is available for:
✅ Bar Charts - Click on any bar segment
✅ Line Charts - Click on any data point
✅ Area Charts - Click on any area segment
✅ Pie Charts - Click on any pie slice
✅ Donut Charts - Click on any donut segment
✅ Stacked Charts - Click on any stack segment
✅ Grouped Charts - Click on any group element
❌ Not available for:
- Data Grid tables
- Pivot Tables
- Big Number displays
Best Practices
Effective Drill-Down Strategies
Start with broad categories:
- Use high-level groupings for initial views
- Drill down to more specific segments
- Follow logical hierarchies (Country → State → City)
Choose meaningful drill-down fields:
- Select fields that provide actionable insights
- Avoid fields with too many unique values
- Consider business hierarchies and relationships
Use breadcrumbs for navigation:
- Navigate back to previous levels to explore different paths
- Return to "Original Chart" to start fresh
- Compare different drill-down paths
Performance Considerations
Large datasets:
- Drill-down applies client-side filtering for speed
- Original data is cached for fast navigation
- Complex date formatting is handled efficiently
Memory management:
- Modal closes cleanly to free resources
- Drill-down stack is cleared when closing
- Auto-save is disabled within drill-down modal
Troubleshooting
"No drill-down fields available":
- Ensure your dataset has categorical fields suitable for drill-down
- Check that fields aren't all custom/calculated fields
- Verify data is loaded properly
Drill-down not showing expected data:
- Check original chart filters - they apply to drill-down too
- Verify the selected segment actually contains data
- Ensure date formatting matches between chart and data
Modal not opening:
- Try refreshing the page and attempting again
- Check browser console for JavaScript errors
- Ensure you're right-clicking directly on chart segments
Navigation issues:
- Use breadcrumb navigation instead of browser back button
- Close and reopen drill-down modal if navigation becomes unresponsive
- Return to "Original Chart" to reset drill-down state
Related Features
- Charts - Main chart configuration and features
- Report Builder - Dashboard creation with drill-down access
- Chart Types - Field requirements and constraints for different chart types